|
Event Data & Analytics
What Event Leaders Should Actually Measure Beyond Registrations
What Event Leaders Should Actually Measure Beyond Registrations
What Event Leaders Should Actually Measure Beyond Registrations
|
Event Data & Analytics

Daily metrics leaders needs to check for data-driven decisions
Daily metrics leaders needs to check for data-driven decisions
Latest Blogs


For years, event success has been measured through surface-level metrics: registrations, attendance rate, and maybe post-event satisfaction. These numbers are easy to track and easy to report, but they rarely reflect the true quality or impact of an event.
Modern events are more complex. They are dynamic environments shaped by movement, behavior, engagement, and real-time decisions. Measuring success today requires going beyond static numbers to understand how the event performs in real time.
The question is no longer how many attended. The question is what they experienced and how effectively the event delivered value.
The problem with traditional event metrics
Registrations are often treated as the primary success indicator. But registrations alone can be misleading.
An event can achieve high registration numbers while still:
Delivering poor session engagement
Creating bottlenecks at check-in or access points
Failing to connect the right people
Lacking visibility into attendee behavior
Producing weak sponsor outcomes
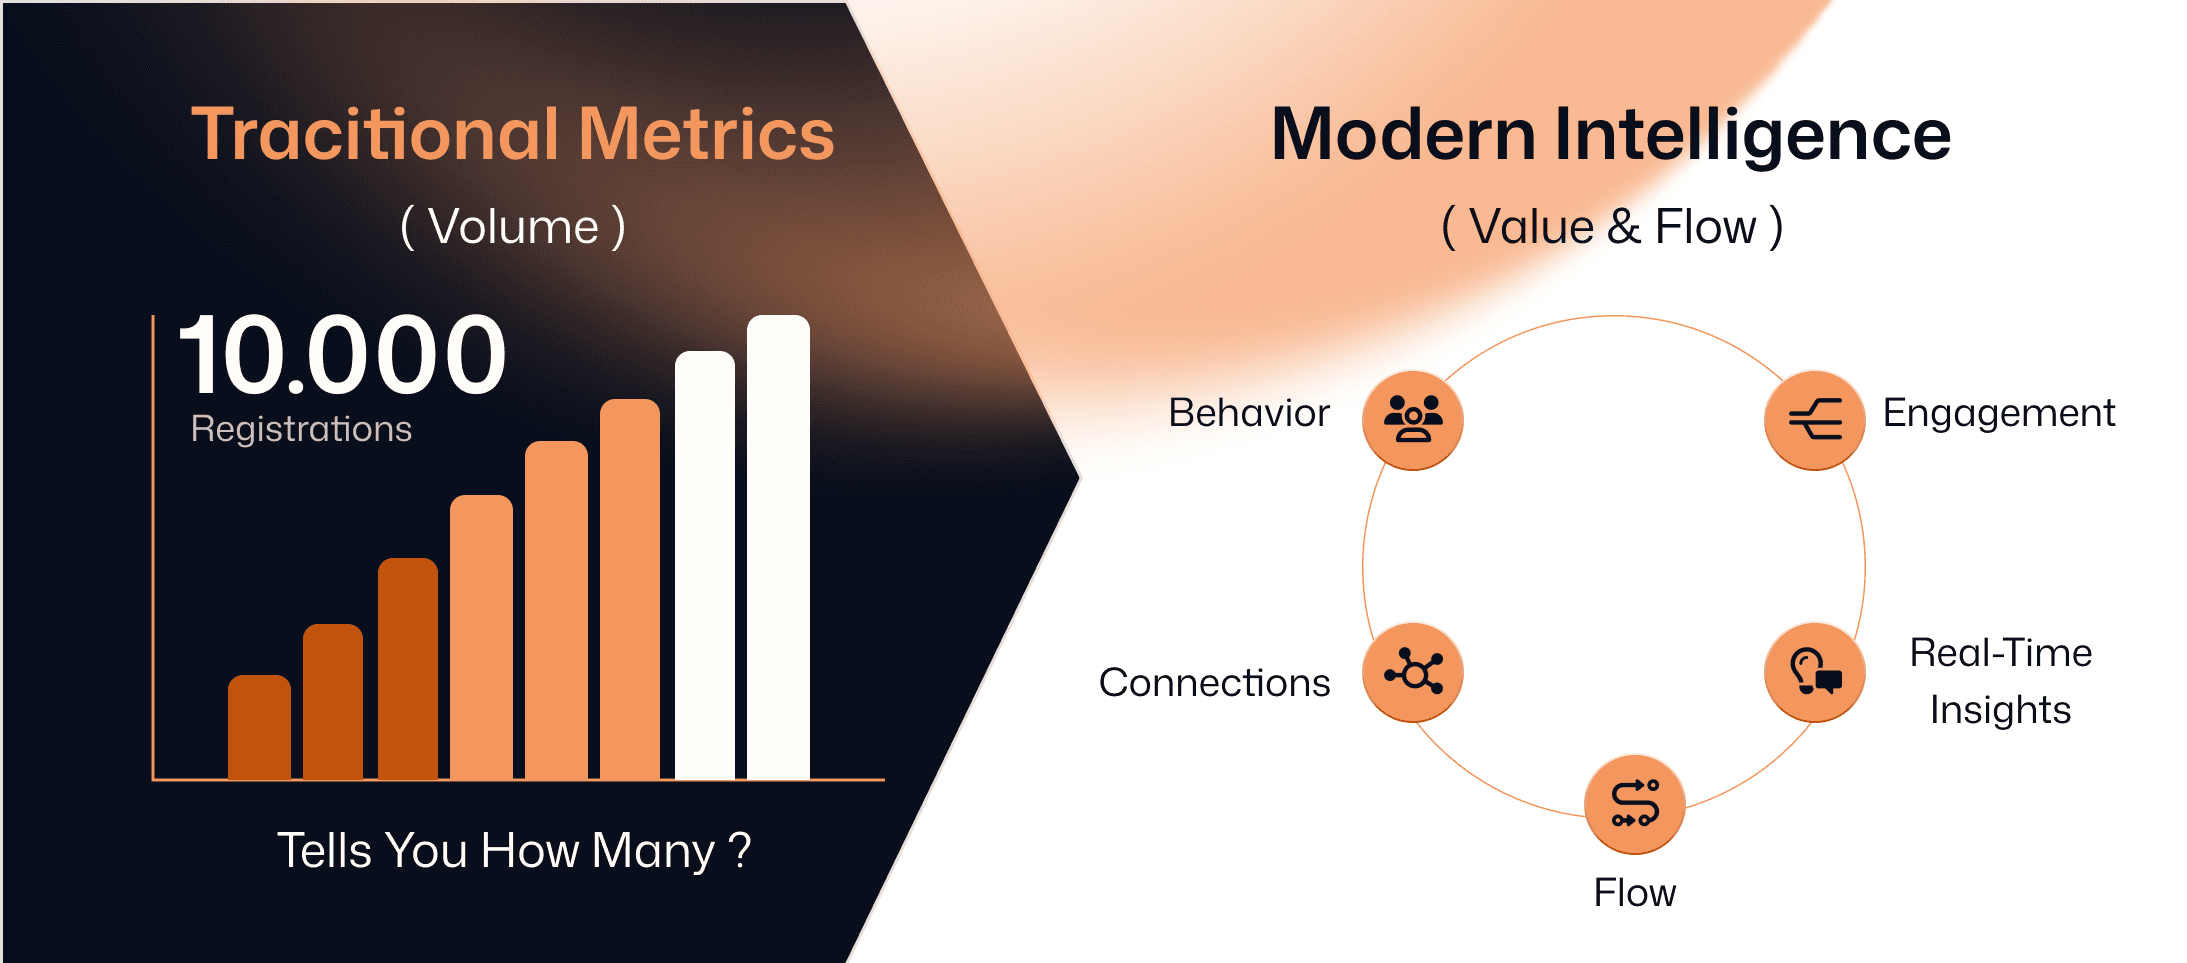
The gap exists because traditional metrics focus on volume, not quality of experience or operational performance. Event leaders need visibility into what is happening during the event, not just before and after it.
The shift: from attendance to behavior and flow
The most valuable event insights today come from understanding movement, interaction, and engagement patterns.
This includes:
Where attendees go
What sessions they prioritize
How long they stay engaged
How they move between spaces
Who they connect with
Where friction occurs
These signals reveal whether the event is functioning as intended or quietly breaking behind the scenes.
This is where real-time analytics becomes essential. Not for reporting later, but for adjusting the experience while it is still live.
The daily metrics that actually matter
To understand event performance, leaders need to monitor a set of operational and behavioral metrics throughout the day.
1. Check-in and access flow
Check-in speed and access validation are early indicators of operational health.
Metrics to track:
Check-in volume by hour
Average check-in time
Access denial or escalation rates
Badge printing throughput
If issues appear here, they will likely cascade into the rest of the event.
2. Session demand vs actual attendance
Not all sessions perform as expected. Understanding demand versus real attendance reveals content relevance and planning accuracy.
Metrics to track:
Session demand (bookmarks, adds to schedule)
Actual check-ins per session
Drop-off rates
Capacity vs utilization
This helps identify overcrowding, underperformance, and missed expectations.
3. Engagement depth, not just presence
Being present does not mean being engaged.
Metrics to track:
Time spent in sessions
Repeat attendance patterns
Interaction with content or features
Engagement across different zones
This shows whether attendees are actively participating or passively moving through the event.
4. Networking quality and connection behavior
Networking is often a core objective, especially in executive and enterprise environments.
Metrics to track:
Connection requests sent and accepted
Messaging activity
Match relevance (based on roles, interests, intent)
Profile completion rates
Strong networking metrics indicate that the event is facilitating meaningful interactions, not just proximity.
5. Movement and venue flow
Understanding how attendees move across spaces is critical for both experience and operations.
Metrics to track:
Venue entry scans by location
Traffic peaks by hour
Movement patterns between zones
Congestion points
This helps teams adjust staffing, capacity, and flow in real time.
6. Support and issue resolution
Support is one of the clearest signals of friction.
Metrics to track:
Number of support requests
Resolution time
Issue categories
Repeat issues
A spike in support often highlights deeper system or experience gaps.
7. Revenue and transaction behavior
For events with ticketing tiers, upgrades, or on-site sales, revenue metrics provide another layer of insight.
Metrics to track:
Sales by ticket type
On-site purchases
Upgrade behavior
Revenue by segment
This connects experience performance to commercial outcomes.
Why daily visibility changes everything
The value of these metrics is not in reporting them later. It is in acting on them while the event is live.
If session demand exceeds capacity, adjustments can be made.
If certain zones are overcrowded, flow can be redirected.
If engagement in networking is low, prompts or interventions can be introduced.
If support requests spike, root causes can be addressed immediately.
Without this visibility, teams are forced to react blindly or wait until the event is over to understand what went wrong.
From data collection to operational intelligence
Collecting data is not the same as using it effectively.
Many event setups still rely on fragmented data sources:
One system for registration
Another for check-in
Another for content
Another for networking
Another for reporting
This creates delays, inconsistencies, and limited visibility during the event.
A more effective model is having a connected operational layer where these signals come together in real time.
This is where Blink ExperienceOS changes how event metrics are used.
By bringing registration, access, attendee identity, session activity, networking, support, and operations into one environment, Blink enables teams to see a live, unified picture of the event.
Instead of assembling reports after the fact, teams can monitor performance as it happens and respond with clarity.
What modern event success actually looks like
Success is no longer defined by how many people registered.
It is defined by:
How smoothly the event operated
How engaged attendees were
How relevant connections became
How effectively teams responded in real time
How clearly outcomes can be measured and explained
The strongest events are not just well-attended. They are well-understood.
The future of event measurement
As events continue to evolve, the expectations around measurement will evolve with them.
Leaders will need:
Real-time visibility, not delayed reporting
Behavioral insight, not just attendance numbers
Operational awareness, not isolated dashboards
Connected systems, not fragmented tools
Because in the end, you cannot improve what you cannot see.
For years, event success has been measured through surface-level metrics: registrations, attendance rate, and maybe post-event satisfaction. These numbers are easy to track and easy to report, but they rarely reflect the true quality or impact of an event.
Modern events are more complex. They are dynamic environments shaped by movement, behavior, engagement, and real-time decisions. Measuring success today requires going beyond static numbers to understand how the event performs in real time.
The question is no longer how many attended. The question is what they experienced and how effectively the event delivered value.
The problem with traditional event metrics
Registrations are often treated as the primary success indicator. But registrations alone can be misleading.
An event can achieve high registration numbers while still:
Delivering poor session engagement
Creating bottlenecks at check-in or access points
Failing to connect the right people
Lacking visibility into attendee behavior
Producing weak sponsor outcomes
The gap exists because traditional metrics focus on volume, not quality of experience or operational performance. Event leaders need visibility into what is happening during the event, not just before and after it.
The shift: from attendance to behavior and flow
The most valuable event insights today come from understanding movement, interaction, and engagement patterns.
This includes:
Where attendees go
What sessions they prioritize
How long they stay engaged
How they move between spaces
Who they connect with
Where friction occurs
These signals reveal whether the event is functioning as intended or quietly breaking behind the scenes.
This is where real-time analytics becomes essential. Not for reporting later, but for adjusting the experience while it is still live.
The daily metrics that actually matter
To understand event performance, leaders need to monitor a set of operational and behavioral metrics throughout the day.
1. Check-in and access flow
Check-in speed and access validation are early indicators of operational health.
Metrics to track:
Check-in volume by hour
Average check-in time
Access denial or escalation rates
Badge printing throughput
If issues appear here, they will likely cascade into the rest of the event.
2. Session demand vs actual attendance
Not all sessions perform as expected. Understanding demand versus real attendance reveals content relevance and planning accuracy.
Metrics to track:
Session demand (bookmarks, adds to schedule)
Actual check-ins per session
Drop-off rates
Capacity vs utilization
This helps identify overcrowding, underperformance, and missed expectations.
3. Engagement depth, not just presence
Being present does not mean being engaged.
Metrics to track:
Time spent in sessions
Repeat attendance patterns
Interaction with content or features
Engagement across different zones
This shows whether attendees are actively participating or passively moving through the event.
4. Networking quality and connection behavior
Networking is often a core objective, especially in executive and enterprise environments.
Metrics to track:
Connection requests sent and accepted
Messaging activity
Match relevance (based on roles, interests, intent)
Profile completion rates
Strong networking metrics indicate that the event is facilitating meaningful interactions, not just proximity.
5. Movement and venue flow
Understanding how attendees move across spaces is critical for both experience and operations.
Metrics to track:
Venue entry scans by location
Traffic peaks by hour
Movement patterns between zones
Congestion points
This helps teams adjust staffing, capacity, and flow in real time.
6. Support and issue resolution
Support is one of the clearest signals of friction.
Metrics to track:
Number of support requests
Resolution time
Issue categories
Repeat issues
A spike in support often highlights deeper system or experience gaps.
7. Revenue and transaction behavior
For events with ticketing tiers, upgrades, or on-site sales, revenue metrics provide another layer of insight.
Metrics to track:
Sales by ticket type
On-site purchases
Upgrade behavior
Revenue by segment
This connects experience performance to commercial outcomes.
Why daily visibility changes everything
The value of these metrics is not in reporting them later. It is in acting on them while the event is live.
If session demand exceeds capacity, adjustments can be made.
If certain zones are overcrowded, flow can be redirected.
If engagement in networking is low, prompts or interventions can be introduced.
If support requests spike, root causes can be addressed immediately.
Without this visibility, teams are forced to react blindly or wait until the event is over to understand what went wrong.
From data collection to operational intelligence
Collecting data is not the same as using it effectively.
Many event setups still rely on fragmented data sources:
One system for registration
Another for check-in
Another for content
Another for networking
Another for reporting
This creates delays, inconsistencies, and limited visibility during the event.
A more effective model is having a connected operational layer where these signals come together in real time.
This is where Blink ExperienceOS changes how event metrics are used.
By bringing registration, access, attendee identity, session activity, networking, support, and operations into one environment, Blink enables teams to see a live, unified picture of the event.
Instead of assembling reports after the fact, teams can monitor performance as it happens and respond with clarity.
What modern event success actually looks like
Success is no longer defined by how many people registered.
It is defined by:
How smoothly the event operated
How engaged attendees were
How relevant connections became
How effectively teams responded in real time
How clearly outcomes can be measured and explained
The strongest events are not just well-attended. They are well-understood.
The future of event measurement
As events continue to evolve, the expectations around measurement will evolve with them.
Leaders will need:
Real-time visibility, not delayed reporting
Behavioral insight, not just attendance numbers
Operational awareness, not isolated dashboards
Connected systems, not fragmented tools
Because in the end, you cannot improve what you cannot see.


Experience what's
next with Blink
Experience what's
next with Blink
Experience what's
next with Blink
Join our community and stay ahead with exclusive news and updates.
Experience what's
next with Blink
Join our community and stay ahead with exclusive news and updates.
Orchestrate Limitless
Experiences, Effortlessly.
It’s one thing to talk about Blink…another to see it in action.
Orchestrate Limitless
Experiences, Effortlessly.
It’s one thing to talk about Blink…another to see it in action.
Orchestrate Limitless
Experiences, Effortlessly.
It’s one thing to talk about Blink…another to see it in action.
Orchestrate Limitless
Experiences, Effortlessly.
It’s one thing to talk about Blink
another to see it in action.
Trusted by
" height="36.999998935290364px" id="U8lSvJQnz" width="76.99999479379187px"/></svg>)
" height="35.946300804560565px" id="JOXlSIPVT" width="140.9905775924913px"/></svg>)


Trusted by
Trusted by
Get an AI summary of Blink

Exclusive Partnership


Get an AI summary of Blink
Exclusive Partnership
Get an AI summary of Blink
Exclusive Partnership
Get an AI summary of Blink
Exclusive Partnership